At Sference we run multiple frontier open-weight models across a large GPU fleet, serving many clients at once.
We noticed that sometimes, when the traffic to a model reached what its GPUs could handle, or went slightly over it, performance degraded for many of its users.
That's how LLM serving behaves past capacity. An engine that admits more work than it can serve doesn't just slow down. It ends up serving fewer requests well than it would have at capacity.
Part of it is the familiar noisy-neighbor effect: an engine at capacity works through one queue, so a burst of long prompts holds up the short requests behind it. The worse part is the cache. Once more work is admitted than the KV cache can hold, the engine starts evicting prefixes that other requests are about to reuse. Those requests come back cold and need a full prefill, which is exactly the extra work an overloaded engine can't afford, so throughput drops just as demand peaks. A few very large requests arriving together can be enough to start it: they evict each other's cache, each new turn needs a full prefill again, and each request queued behind them has to wait.
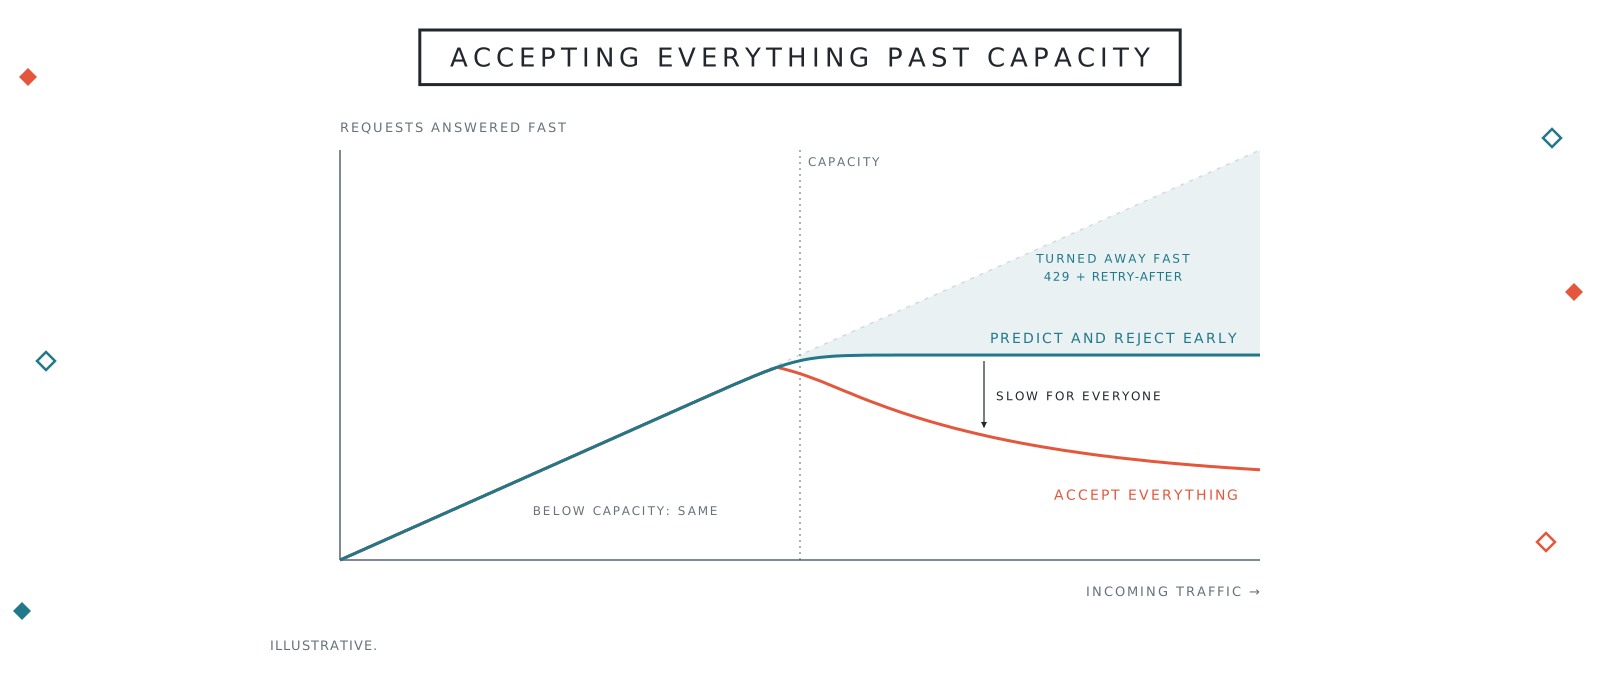
On the other hand, we've also had customers with strict latency requirements, who would rather fall back to another provider or a different model whenever our fast service can't guarantee them a fast response.
We didn't want to impose per-request limits, because what a request costs depends heavily on the request itself and on how much of it is already cached. A fixed concurrency limit doesn't work for the same reasons.
For example, an 800,000-token request from an active session that is 99% cached is prefilled in a fraction of a second, while a cold 300,000-token request can take seconds.
Predicting the work instead of counting requests
Instead of a limit, we weight each request by predicting the amount of work, or time, it will take to serve. Then we can reject quickly and ask the customer to retry, instead of making them wait tens of seconds, or minutes, for a response and charging them for it.
The same prediction is also very useful for routing requests smartly.
At a high level, the time to first token on a given worker comes down to two numbers: how long the request waits for the prefill already ahead of it, and how long its own uncached prefill takes (our CTO Aleksander Pejcic walks through both in his post on prefill concurrency). We work both out for every worker that could serve the request, before we send it anywhere. That needs three things: what that worker already has cached, how much prefill is ahead of it, and how fast it gets through prefill.
predicted TTFT ≈ queue wait + own prefill
own prefill    ≈ uncached tokens / worker's prefill rate    (first approximation)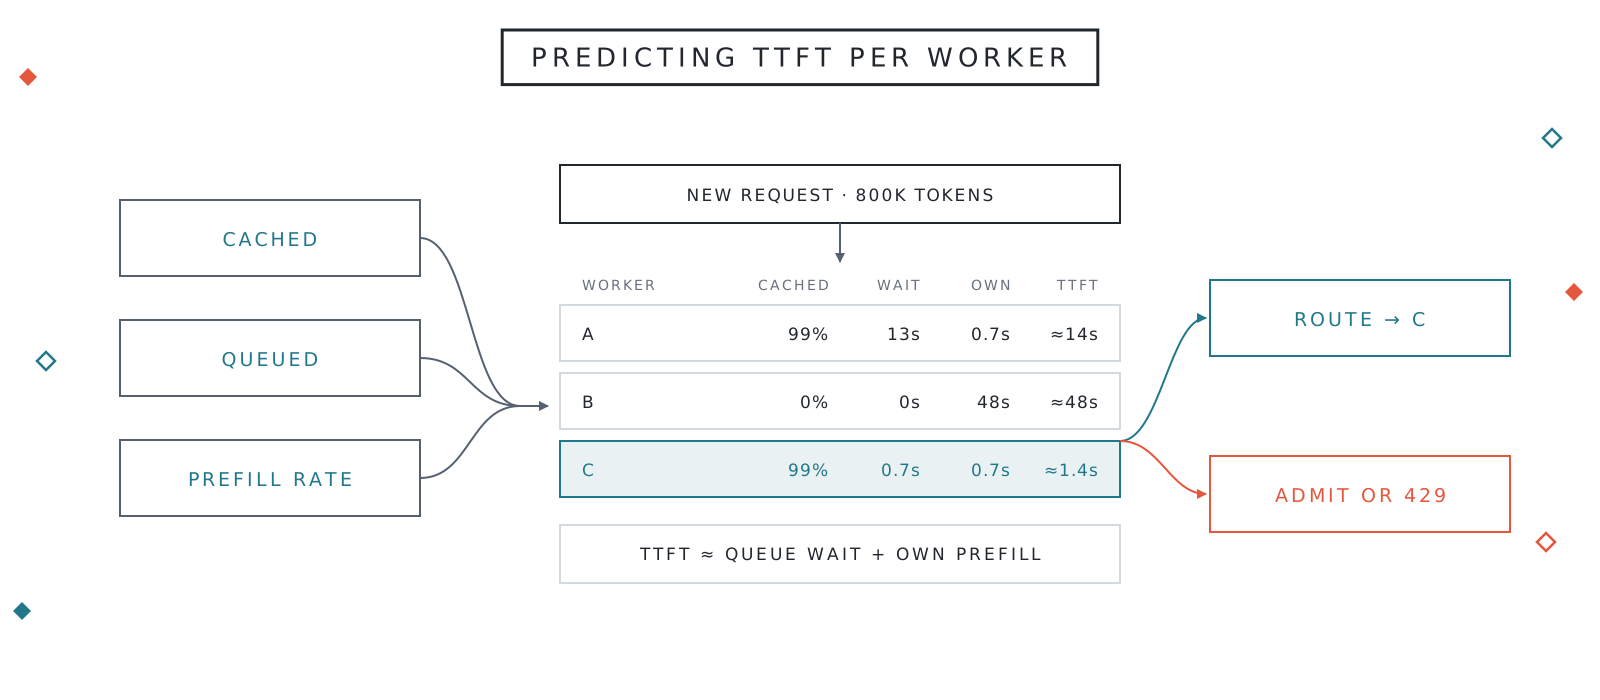
What's already cached
We need an index of the engine's cache because the cache determines how much prefill work there is. As in the example above, an 800K-token request with a 99% cache hit is far less work than a cold 300K one. Caching in the engine can be tricky: it often depends on the model architecture, and it isn't limitless. Cache gets evicted, and our scheduler needs to know when that happens. That's why we maintain a live index of the cache state across our whole fleet, from GPU memory to CPU offload to caches shared between engines.
Most serving engines and KV cache systems, vLLM, SGLang and LMCache among them, can report whenever they store or evict a block of KV cache. Our scheduler subscribes to those events. It tracks evictions as well as stores, because cache space is finite and a prefix that was cached a minute ago may be gone now.
We also use a shared cache and offload the KV cache from GPU memory, and the index works with both, but that's a story for another post.
Cache layout, and the cache events that describe it, depend on the model and on how it's served. Speculative decoding with EAGLE, for example, changes the cache layout. The index needs to account for those differences to estimate how much of a prompt each worker can reuse.
How fast each worker prefills
Prefill speed depends on the hardware, the model, the specific engine and its configuration. We run a heterogeneous mix of all of these, each specialized for different tasks, which is how we achieve strong performance. So we monitor, observe, and learn each running model instance's prefill rate.
Each worker measures its own prefill speed from requests that had nothing cached and nothing else running at the same time, because then the time to first token is almost entirely prefill. The rate is measured and updated continuously, so it stays current as traffic and software versions change. There is no table of rates that needs maintaining. A new model or engine version starts from a conservative default, and a configuration change discards the old measurements.
Prefill time also isn't linear in prompt length. The feed-forward layers cost the same per token, but in standard attention every token looks at every token before it, so that part grows with the square of the context. Short prompts barely notice; at long contexts it catches up and takes over. How strongly a model bends depends on its architecture: sparse attention and linear-attention hybrids bend much less. So once a worker has enough suitable samples, it fits its own curve, C(N) = a·N + b·N², and prices a request as C(whole prompt) − C(cached part), because the new tokens still attend to the cached context. On one of our DeepSeek deployments the fit came out at roughly 30·N + 37·N² seconds, with N in millions of tokens: a cold 300K-token prompt takes about 12 seconds, a cold million about a minute, and around that point the squared part becomes the larger one.
How much is ahead of you
Counting requests ahead of you says almost nothing, for the same reason a request limit doesn't work. We count queued prefill in tokens. Engines also don't serve prefill strictly one request at a time: with chunked prefill, one engine step can carry chunks of several prompts. So instead of a formula, the scheduler replays how the engine will hand out its per-step token budget, using the settings each engine actually reports. A small prompt behind a giant one is then priced as slipping between its chunks, which is what really happens, instead of waiting for the whole giant to finish.
What we do with the prediction
Routing
It depends, and the predicted TTFT tells us that to some degree. If we predict that an idle but cold worker will be faster than the prefill queue on the warm one, we might swap and serve the request from the cold one. It can also depend on the client's preferences: a client may prefer a cache hit even if it means waiting longer for the response.
Predicted TTFT is one of the signals the router weighs, alongside each worker's load and how much of the prompt it already has cached. A conversation usually stays on the worker that holds its history, until staying there would cost more than starting over somewhere else.
Admission
We have clients using our API in production services. They care a lot about user experience, which means fast responses. We offer very competitive prices and usually the fastest responses in the EU. As a backup, they keep another provider or a different model, so they can quickly fall back to it when we can't respond fast enough.
That's why our endpoints let a request specify the longest it's willing to wait (max_queue_wait_s, anywhere from 5 to 300 seconds). The bound covers waiting behind other work: the time the request has already waited plus the wait we project on the worker. If it won't make it, the request is quickly turned away with a 429 and a Retry-After, in the shape OpenAI and Anthropic clients already handle.
Even if the client sets no bound, when we detect that our engine is severely overloaded we might return a 429 and ask the client to retry. That's a better user experience than letting them hang for minutes.
We're not the first to predict TTFT. Mooncake, Moonshot AI's serving platform for Kimi, picks a prefill instance by estimated TTFT, queue wait plus prefill given that instance's cached prefix, and rejects requests that would miss their targets. Its prefill-time model is fitted offline. Our fleet is heterogeneous on purpose: multiple engine families and versions, many with model-specific patches of our own, running different models on different hardware and GPU generations, each configured for the work it serves. So each worker learns its own rate online, cache state comes from each engine's own events, and the step scheduling is replayed per engine.
How we know it's working
We monitor and analyze the prediction continuously. We know the actual serving time of every request we serve, so each one grades the prediction we made for it.
When a request is granted to a worker, the scheduler records its predicted TTFT together with everything that went into it: the cache it credited, the queue it saw, the rate it used. When the first token arrives, the worker measures the real one, and we compare the two.
Average error is a poor way to grade this. Against a 5-second budget, predicting 0.2 seconds for a request that takes 3 matters much less than predicting 3 for one that takes 30. What matters is whether the prediction and the outcome land on the same side of the bound. There are two ways to be wrong: an underprediction, where we admit a request expecting it to be fast and it isn't, and a false alarm, where we turn away a request that would have been served in time. Served requests show us the first directly. The second is harder, because a rejected request never gets a TTFT.
Which of the two is worse depends on the use case. Both should be minimal.
Across Kimi-K3, GLM-5.3, GLM-5.3-Flash and DeepSeek-V4-Flash over 48 hours, 94% of predictions landed within one second of the actual time to first token, and 99% within ten seconds.
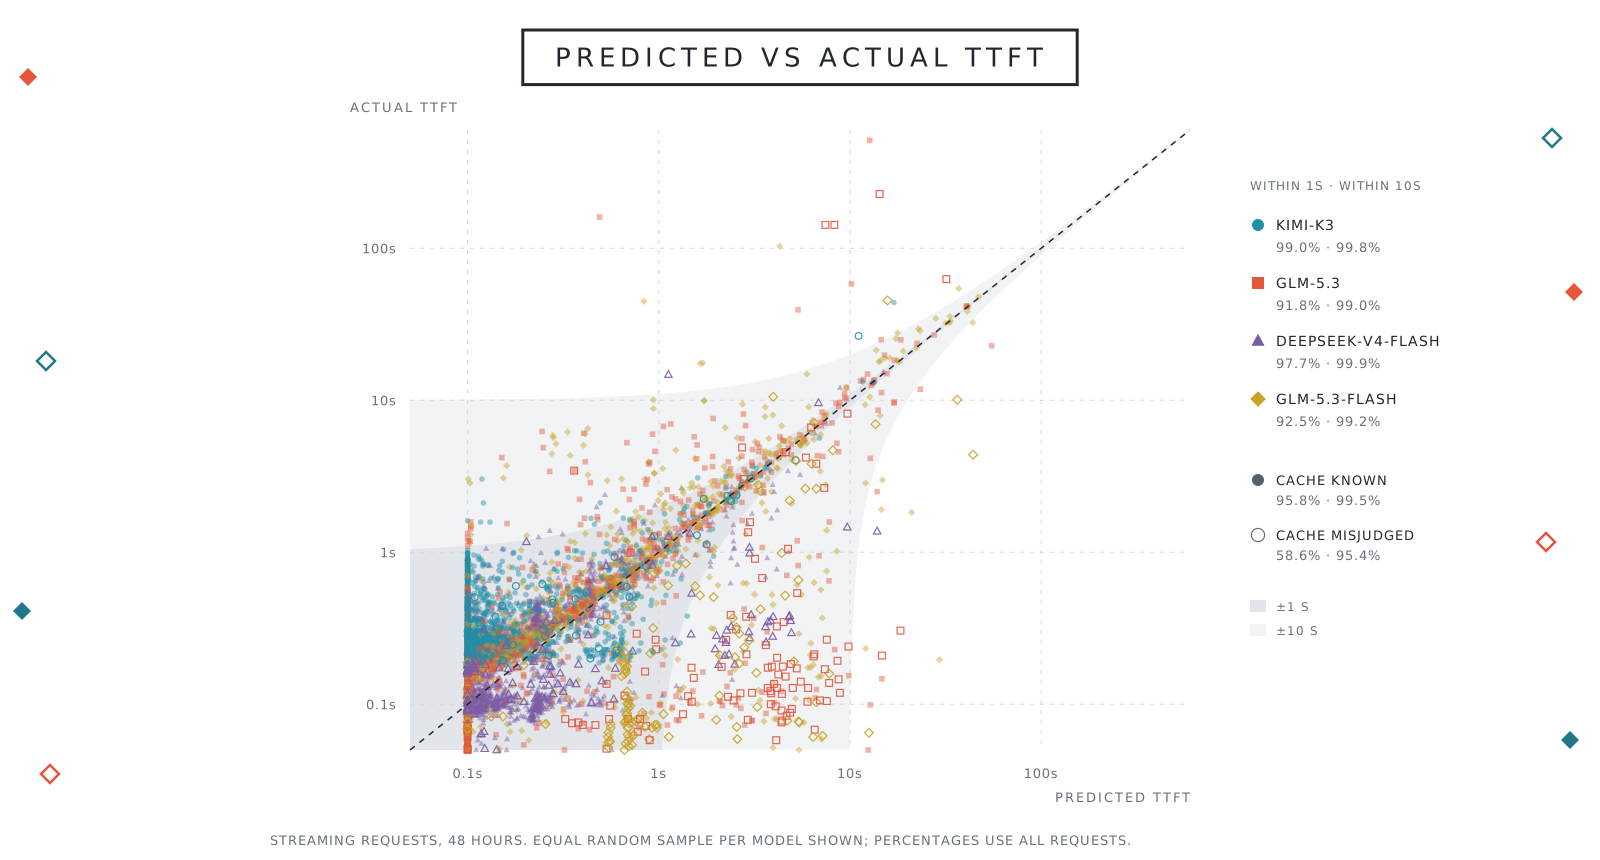
The hollow marks show requests where the scheduler's cache estimate differed from what the engine actually reused—about 4% of requests in this sample. This measures disagreement about cache reuse; it doesn't mean those requests failed or missed their latency targets. Predictions were within one second for 95.8% of requests whose cache estimates matched, compared with 58.6% when they differed. That gap gives us a concrete direction for improvement: keeping the scheduler's cache view aligned with the engine.
Predicting latency lets us decide before committing a request to a busy worker: pick a faster worker, or reject early enough for the client to fall back.